Eta Car MONITORING CAMPAIGN
Measurements made at Pico dos Dias Observatory: LNA/Brazil:
A. Damineli, N. Leister, R. Levenhagen
(click on figures to enlarge)
Link to Mike Corcoran's page: X-ray light curve
updated daily
http://lheawww.gsfc.nasa.gov/users/corcoran/eta_car/etacar_rxte_lightcurve/
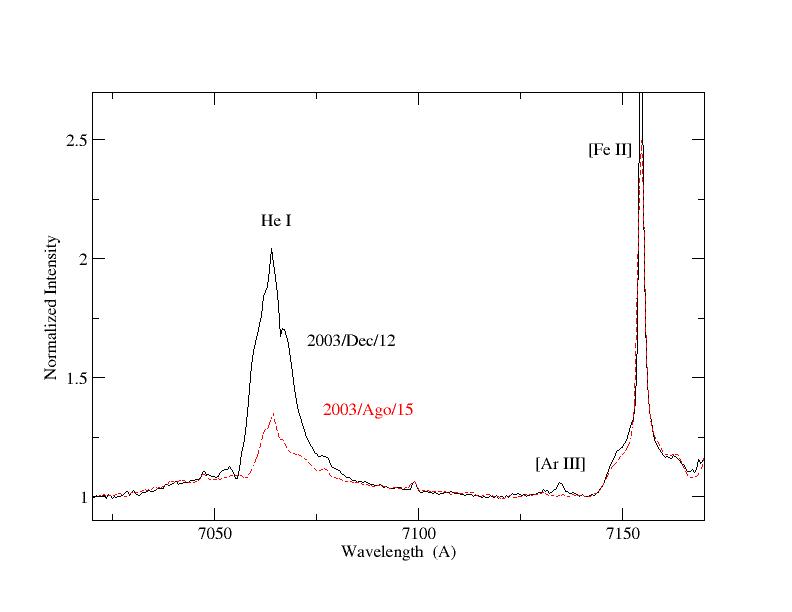
June/2004 - Steiner andDamineli, when analizing the spectra collected during the 2003.5 spectroscopic event, made a surprising discovery: the HeII 4686 A shows upd strongly exactely when all other emission lines were fading! This is the first direct evidence for the wind of the invisible companion star. Click on the links to download the PDF file of the paper just submitted to ApJ Letters (etacar_heII.ps.zip: 80 Kb, etacar_heII.pdf: 80 Kb ).
12-14/December/2003 - Observation conducted at Pico dos Dias Observatory (LNA/Brazópolis) by José Henrique Groh and Augusto Damineli have shown that the spectroscopic event is ending. All spectral lines that faded on June/2003 are back, except for [Ne III] 3868 A, the one that needs the highest energy to be excited. We believe that this line will reappear along the next weeks. It is interesting to note that this line is absent from the spectrum for 22 weeks, twice the time the duration of the minimum in X-rays.
(click on the figure to download a high resolution plot)
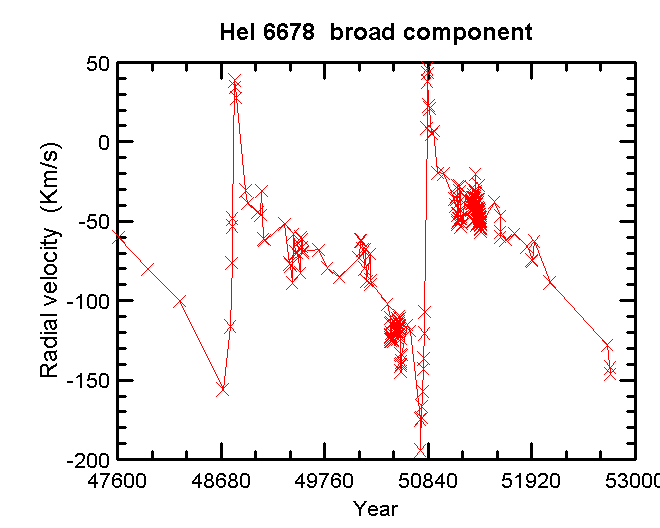
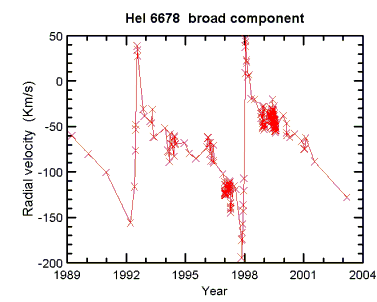
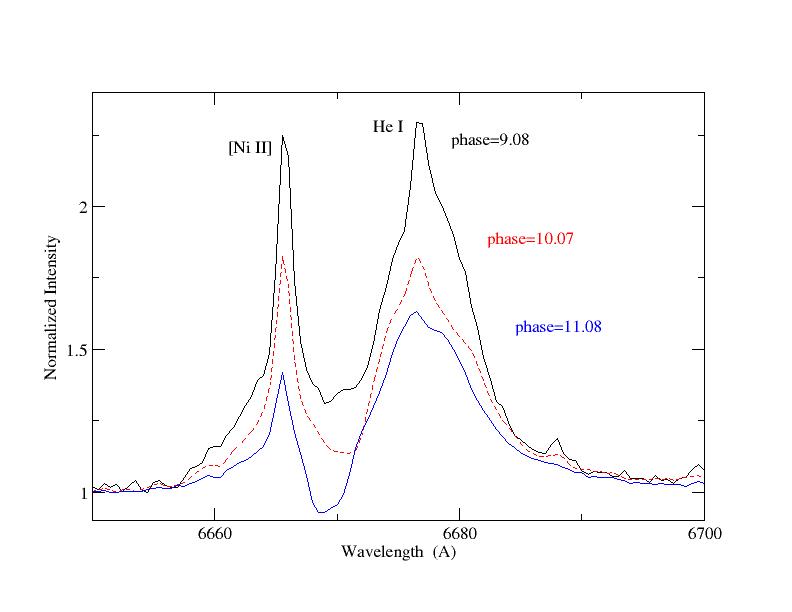
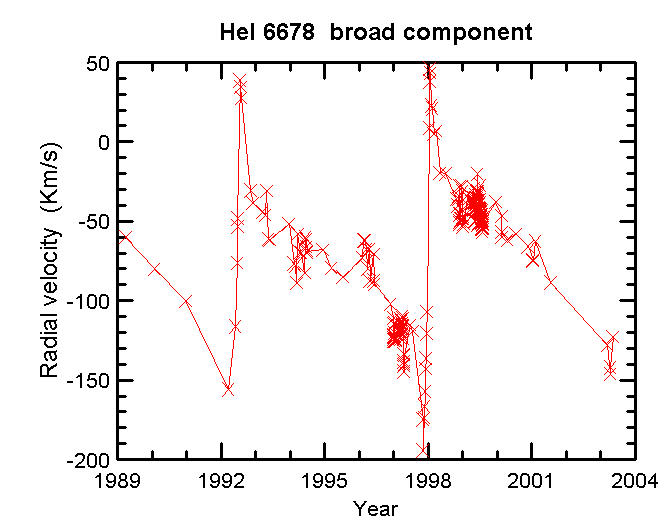
We have noticed also (as a matter of fact since 1996) that the line intensities are decreasing from cycle to cycle. In the plot below, we display the He I 6678 A line in the same phase of the 2025 days cycle (~phase 0.08). We call cycle 11 the one that started on June 29, cycle 10 in December 1997 and cycle 9 in June 1992. This indicates that some component of the system is evolving secularly, altough it is not clear if such a component is the wind of the primary star or the circumstellar material. The fact that the P Cygni absorption component of He I (plus H I and Si II) is becoming deeper with time, is an indication that the wind of the primary star is becoming optically ticker.
(click on the figure to download a high resolution plot)
Click on the link to download a repport we just submitted to IBVS ( PDF format 90 Kb)
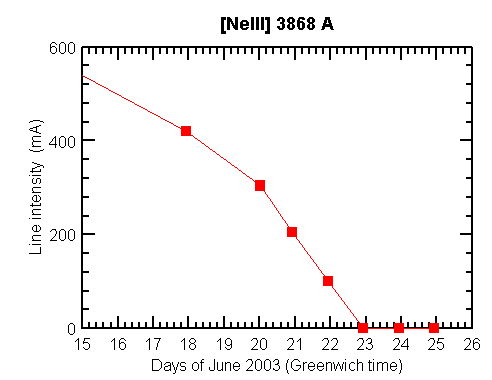
June 12th to July 1st - The first spectral line to disappear completely was [NeIII] 3868 A, that has the highest excitation potential in the optical spectrum of eta Carinae (fist panel below). The observation was made on day 22.9 (Greenwich time), but the plot indicates that the real minimum started on 22.5. My method to derive the period lenght of the 5.5 year cycle is based on the disappearance of the narrow component of HeI 6678 (second panel). In the ongoing event, such a spectral component was recorded as zero on July 1st. However, since July 26th that feature was very faint, only measurabel in spectra of very high S/N ratio. In spectra with the same S/N ratio of the 1997.9 event such a feature would not be measurable and would be assumed to be zero. In tjis way, if we degrade the present spectra to the same S/N as in the previous event, it would be stated to be zeroed on July 26th, implying that the priod is 2026+-1day. In fact, such a period lenght brings a good agreement between the two events (1997.9 AND 2003.5) through all the descending phase.
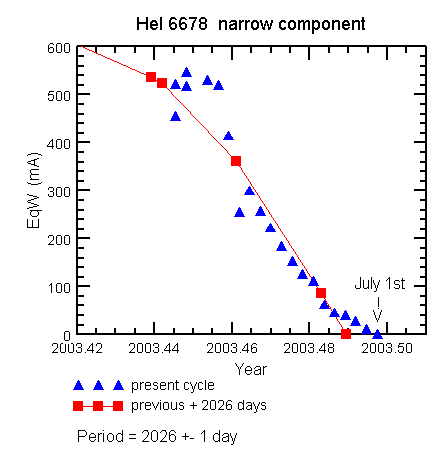
May 29 and June 12th- Filled blue circles are measurements of the narrow component of HeI 6678 A line made on May 29th and June 12th. Red squares are measurements made in the last event (November and December 1997). The red solid line is a linear fit through those data (red squares). By shifting the previous event by 2020 days, the predicted disapearance of the narrow component in the HeI 6678 A line should occour on June 25th (around 17 hs UT.- but dont take the hours and even the day too seriously...). The present cycle seems to be following well the predictions. At least more smoothly than in X-rays. If Mike Corcoran's blood pressure follows his X-ray light curve, he needs to see his doctor immediatly!

13 and 26MAY/2003 -
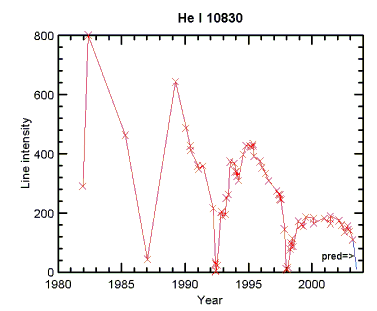
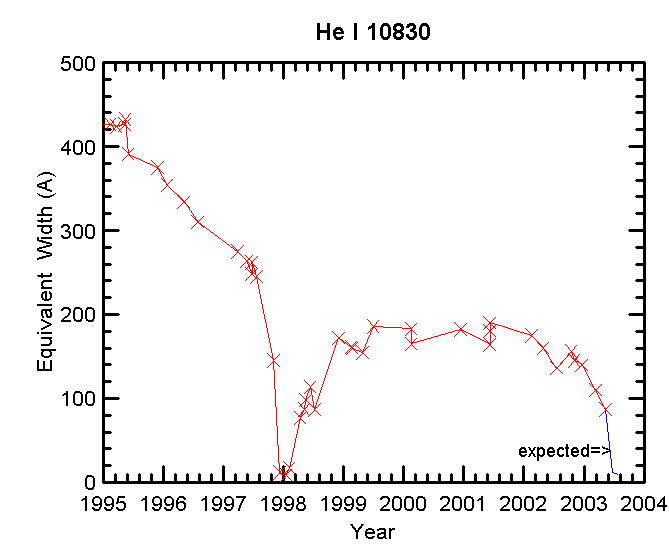
Line intensity HeI 10830-This line continued to fade at almost the
same rate as in the beginning og the year. The gradient is expected to jump
to a much bigger valeu along the next month.
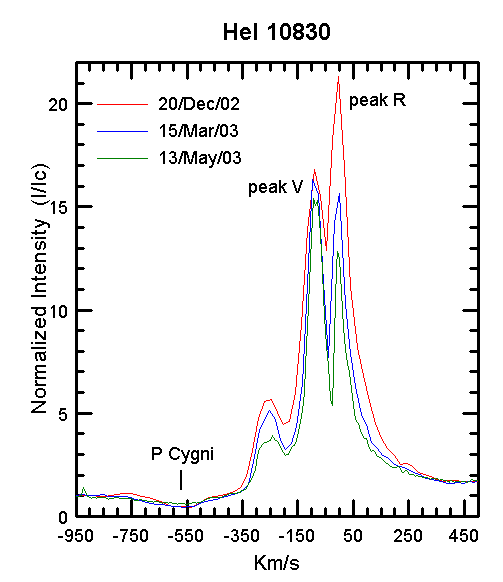
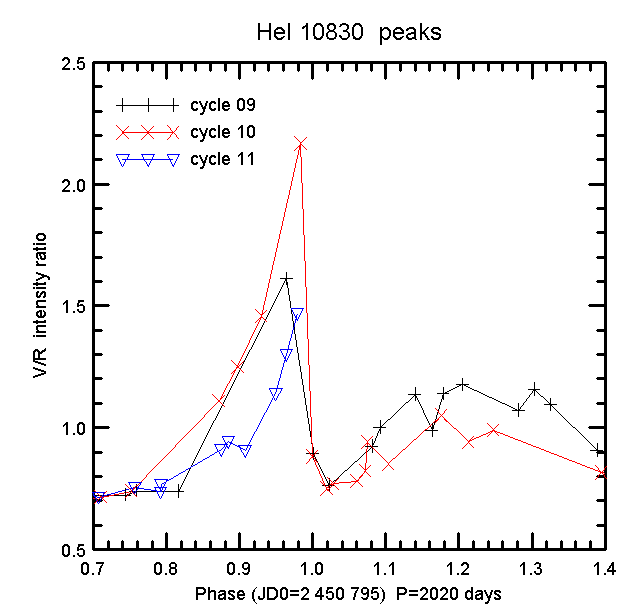
R/V peak intensity ratio - The "Red" peak continued to decrease, but the "Violet" peak remained almost unchanged. The "Violet" peak is expected to crash along the next month.The left panel shows the line profile in units of radial velocity. The panel at right shows the peak intensity ratio as a function of phase. Notice that these spectra were taken with a thinned CCD, plenty of fringes as usual. After removing the fringes the spectrum is very nice, with S/N~100 in the continuum with an expsoure time of 10 minutes in a 1.6-m telescope.
Radial Velocity of the HeI 6678 A line- The broad component of this HeI line returned to the same value it had a month ago. This looks surprising, short-term variations also occurred in the previous cycle.
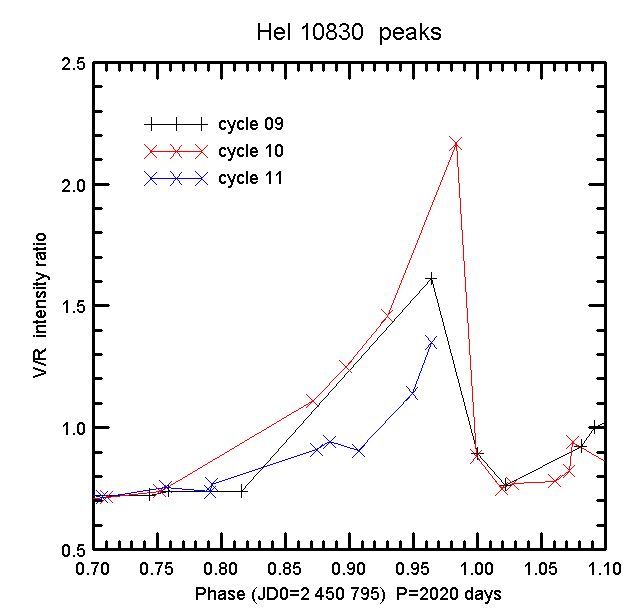
13 and 14/APRIL/2003. (Measurements made at Pico dos Dias Observatory: LNA/Brazil) The spectral line HeI 10830 A continued to faint. The V/R ratio (ratio of intensities between the "Violet" and the "Red"" peaks) continued to increase (blue line), follwoing the same pattern as in the previous cycles (cycle 09 and cycle 10). The absolute values of the peak ratio intensity is decreasing because the stellar continuum is secularly increasing.
The radial velocity of the broad component of HeI 6678 continued to decrease. The last two measurements indicate a sudden decrease, that might be real or an observational error in the previous point (March/2003). The general behavior of the RV curve is following nicely the previous cycles, indicating that the new "event" is approaching.